---
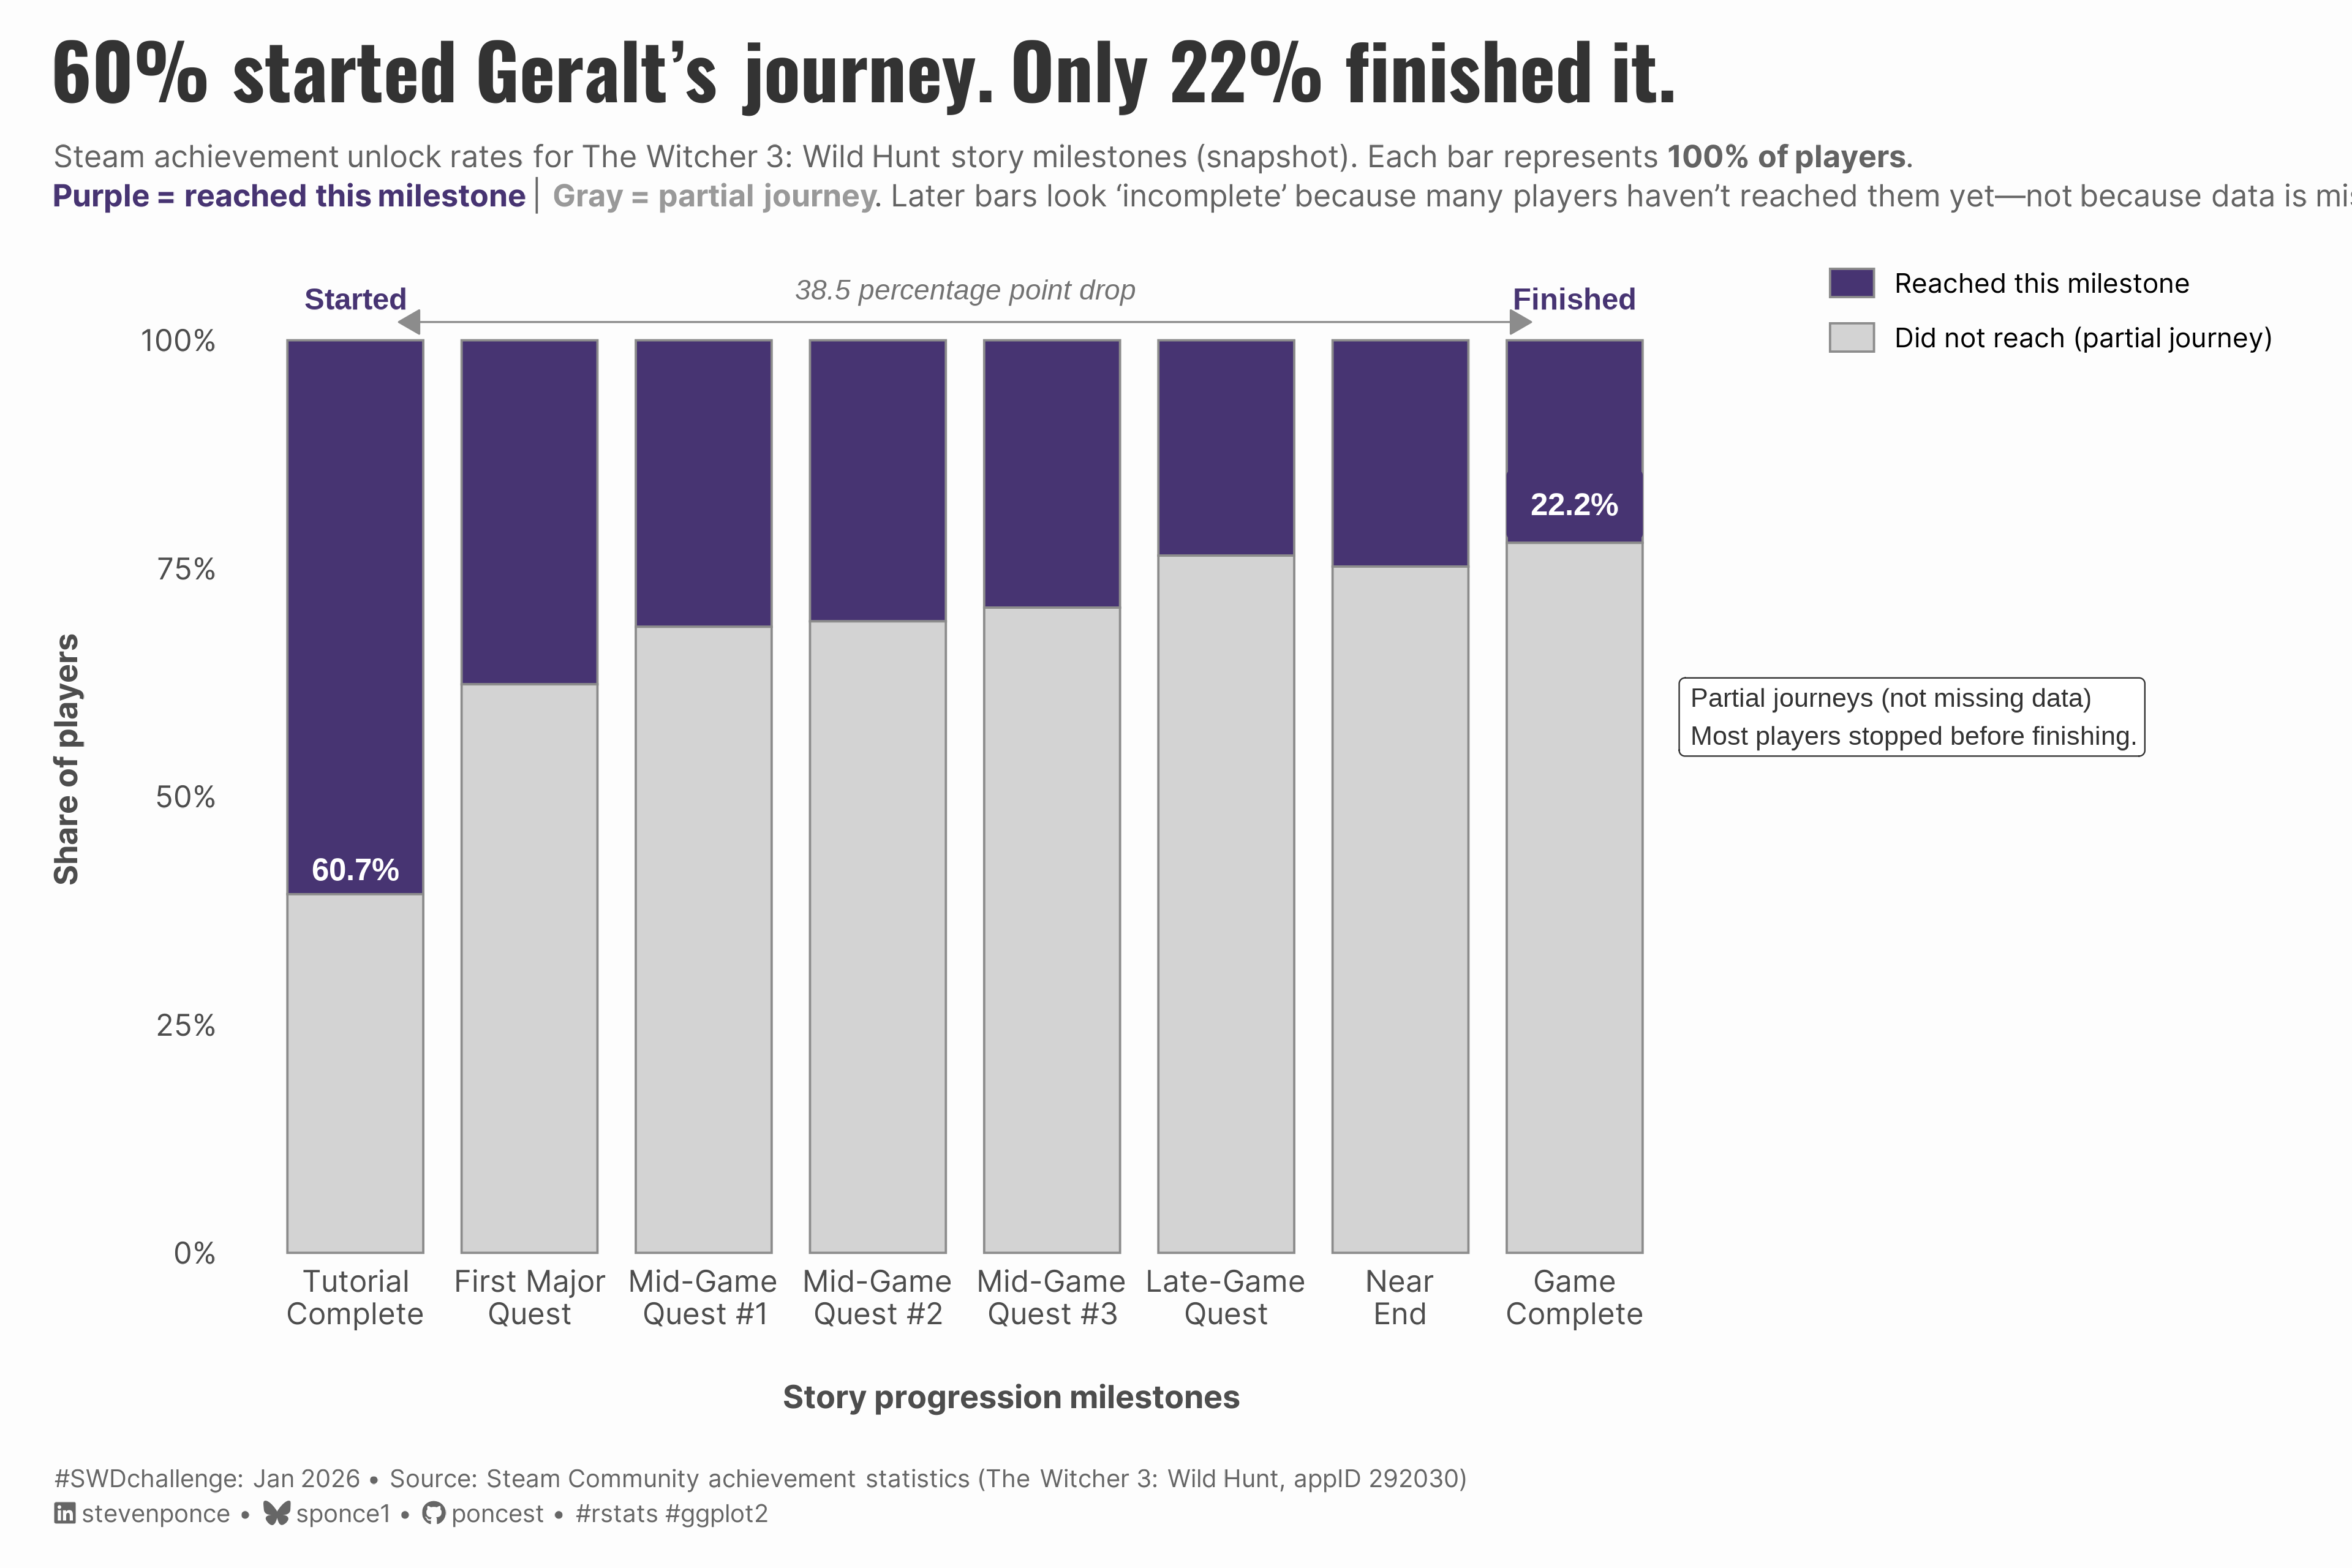
title: "60% started Geralt's journey. Only 22% finished it."
subtitle: "Steam achievement unlock rates for The Witcher 3: Wild Hunt story milestones (snapshot). Each bar represents 100% of players. Purple = reached this milestone | Gray = partial journey. Later bars look 'incomplete' because many players haven't reached them yet—not because data is missing."
description: "January 2026 SWD challenge visualization showing The Witcher 3 player progression through achievement data. Demonstrates partial data as behavioral incompleteness: 60% started, only 22% finished. Stacked bars reveal how incomplete journeys differ from missing data."
author: "Steven Ponce"
date: "2026-01-02"
categories: ["SWDchallenge", "2026"]
tags: [
"behavioral-data",
"gaming-analytics",
"steam-achievements",
"completion-rates",
"player-retention",
"partial-information",
"the-witcher-3",
"ggplot2",
"data-storytelling",
]
image: "thumbnails/swd_2026_01.png"
format:
html:
toc: true
toc-depth: 5
code-link: true
code-fold: true
code-tools: true
code-summary: "Show code"
editor_options:
chunk_output_type: inline
execute:
freeze: true
cache: true
error: false
message: false
warning: false
eval: true
---
### Challenge
This month's challenge invites you to thoughtfully present partial data to ensure the information is interpreted correctly.
Additional information can be found [HERE](https://community.storytellingwithdata.com/challenges/plot-partial-information)
### Visualization
{#fig-1}
### <mark> **Steps to Create this Graphic** </mark>
#### 1. Load Packages & Setup
```{r}
#| label: load

if (!require("pacman")) install.packages("pacman")
pacman::p_load(
  dplyr,
  readr,
  tidyr,
  stringr,
  ggplot2,
  ggtext,
  showtext,
  janitor,
  scales,
  glue
)

### |- figure size ----
camcorder::gg_record(
  dir    = here::here("temp_plots"),
  device = "png",
  width  = 12,
  height = 8,
  units  = "in",
  dpi    = 320
)

# Source utility functions
suppressMessages(source(here::here("R/utils/fonts.R")))
source(here::here("R/utils/social_icons.R"))
source(here::here("R/utils/image_utils.R"))
source(here::here("R/themes/base_theme.R"))
```
#### 2. Read in the Data
```{r}
#| label: read

df <- read_csv(
  here::here("data/SWDchallenge/2026/witcher_story_progression.csv"),
  show_col_types = FALSE
)

### |- Data Source ----
# Primary Source: Steam Community - The Witcher 3: Wild Hunt Global Achievement Statistics
# URL: https://steamcommunity.com/stats/292030/achievements
# Date Accessed: January 1, 2026
# Game: The Witcher 3: Wild Hunt (CD Projekt Red, 2015)
# Steam App ID: 292030
```
#### 3. Examine the Data
```{r}
#| label: examine
#| include: true
#| eval: true
#| results: 'hide'
#| warning: false

glimpse(df)
skimr::skim_without_charts(df)
```
#### 4. Tidy Data
```{r}
#| label: tidy

witcher_df <- df |>
  clean_names() |>
  mutate(
    milestone = row_number(),
    milestone_label = case_when(
      milestone == 1 ~ "Tutorial\nComplete",
      milestone == 2 ~ "First Major\nQuest",
      milestone == 3 ~ "Mid-Game\nQuest #1",
      milestone == 4 ~ "Mid-Game\nQuest #2",
      milestone == 5 ~ "Mid-Game\nQuest #3",
      milestone == 6 ~ "Late-Game\nQuest",
      milestone == 7 ~ "Near\nEnd",
      milestone == 8 ~ "Game\nComplete",
      TRUE ~ achievement_name
    ),
    reached = pct_unlocked / 100,
    not_yet = 1 - reached
  )

plot_df <- witcher_df |>
  select(milestone, milestone_label, achievement_name, reached, not_yet) |>
  pivot_longer(
    cols = c(reached, not_yet),
    names_to = "status",
    values_to = "share"
  ) |>
  mutate(
    status = factor(
      status,
      levels = c("reached", "not_yet"),
      labels = c("Reached this milestone", "Did not reach (partial journey)")
    )
  )

start_pct <- witcher_df |> slice(1) |> pull(reached)
finish_pct <- witcher_df |> slice(8) |> pull(reached)
drop_pp <- (start_pct - finish_pct) * 100
```
#### 5. Visualization Parameters
```{r}
#| label: params

### |-  plot aesthetics ----
colors <- get_theme_colors(
  palette = list(
    col_reached = "#473472",
    col_partial = "#D3D3D3",
    col_white   = "white"
  )
)

### |-  titles and caption ----
title_text <- "60% started Geralt's journey. Only 22% finished it."

subtitle_text <- glue(
  "Steam achievement unlock rates for <i>The Witcher 3: Wild Hunt</i> story milestones (snapshot). ",
  "Each bar represents <b>100% of players</b>.<br>",
  "<span style='color:#473472'><b>Purple = reached this milestone</b></span> | ",
  "<span style='color:#999999'><b>Gray = partial journey</b></span>. ",
  "Later bars look 'incomplete' because many players haven't reached them yet—",
  "not because data is missing."
)

caption_text <- create_swd_caption(
  year = 2026,
  month = "Jan",
  source_text = "Steam Community achievement statistics (The Witcher 3: Wild Hunt, appID 292030)"
)

### |-  fonts ----
setup_fonts()
fonts <- get_font_families()

### |-  plot theme ----
# Start with base theme
base_theme <- create_base_theme(colors)

# Add weekly-specific theme elements
weekly_theme <- extend_weekly_theme(
  base_theme,
  theme(
    # Text styling
    plot.title = element_text(
      face = "bold", family = fonts$title, size = rel(1.4),
      color = colors$palette$title, margin = margin(b = 10), hjust = 0
    ),
    plot.subtitle = element_text(
      family = fonts$subtitle, lineheight = 1.2,
      color = colors$palette$subtitle, size = rel(0.9), margin = margin(b = 20), hjust = 0
    ),

    ## Grid
    panel.grid = element_blank(),
    panel.grid.major.x = element_blank(),
    panel.grid.major.y = element_blank(),
    panel.grid.minor.x = element_blank(),
    panel.grid.minor.y = element_blank(),

    # Axes
    axis.title.x =  element_text(size = rel(0.9), color = "gray30", margin = margin(t = 20)),
    axis.title.y = element_text(size = rel(0.9), color = "gray30",  margin = margin(r = 20)),
    axis.text = element_text(color = "gray30"),
    # axis.text.y = element_text(size = rel(0.95)),
    axis.ticks = element_blank(),

    # Facets
    strip.background = element_rect(fill = "gray95", color = NA),
    strip.text = element_text(
      face = "bold",
      color = "gray20",
      size = rel(1),
      margin = margin(t = 8, b = 8)
    ),
    panel.spacing = unit(2, "lines"),

    # Legend elements
    legend.position = "right",
    legend.title = element_text(
      family = fonts$subtitle,
      color = colors$palette$text, size = rel(0.8), face = "bold"
    ),
    legend.text = element_text(
      family = fonts$tsubtitle,
      color = colors$palette$text, size = rel(0.7)
    ),
    legend.margin = margin(t = 0, r = 0, b = 0, l = 10),

    # Plot margin
    plot.margin = margin(10, 20, 10, 20)
  )
)

# Set theme
theme_set(weekly_theme)
```
#### 6. Plot
```{r}
#| label: plot

p <- ggplot(plot_df, aes(x = milestone, y = share, fill = status)) +

  # Geoms
  geom_col(width = 0.78, color = "grey55", linewidth = 0.4) +
  geom_label(
    data = witcher_df |> filter(milestone == 1),
    aes(x = milestone, y = 0.42, label = percent(reached, accuracy = 0.1)),
    inherit.aes = FALSE,
    fill = colors$palette$col_reached,
    color = "white",
    label.size = 0,
    size = 4,
    fontface = "bold",
    label.padding = unit(0.25, "lines")
  ) +
  geom_label(
    data = witcher_df |> filter(milestone == 8),
    aes(x = milestone, y = 0.82, label = percent(reached, accuracy = 0.1)),
    inherit.aes = FALSE,
    fill = colors$palette$col_reached,
    color = "white",
    label.size = 0,
    size = 4,
    fontface = "bold",
    label.padding = unit(0.65, "lines")
  ) +

  # Annotate
  annotate(
    "text",
    x = 1, y = 1.045, label = "Started",
    color = colors$palette$col_reached, fontface = "bold", size = 3.9, hjust = 0.5
  ) +
  annotate(
    "text",
    x = 8, y = 1.045, label = "Finished",
    color = colors$palette$col_reached, fontface = "bold", size = 3.9, hjust = 0.5
  ) +
  annotate(
    "segment",
    x = 1.25, xend = 7.75, y = 1.02, yend = 1.02,
    linewidth = 0.35, color = "grey55",
    arrow = arrow(ends = "both", type = "closed", length = unit(0.12, "inches"))
  ) +
  annotate(
    "text",
    x = 4.5, y = 1.055,
    label = glue("{round(drop_pp, 1)} percentage point drop"),
    size = 3.6, color = "grey45", fontface = "italic", hjust = 0.5
  ) +
  annotate(
    "label",
    x = 8.6, y = 0.63,
    label = "Partial journeys (not missing data)\nMost players stopped before finishing.",
    hjust = 0, vjust = 1,
    size = 3.4, color = "grey20",
    fill = "white", label.size = 0.25, label.r = unit(0.18, "lines"),
    label.padding = unit(0.35, "lines")
  ) +

  # Scales
  scale_x_continuous(
    breaks = 1:8,
    labels = witcher_df$milestone_label,
    expand = expansion(mult = c(0.04, 0.08))
  ) +
  scale_y_continuous(
    labels = percent_format(accuracy = 1),
    limits = c(0, 1.08),
    expand = expansion(mult = c(0, 0))
  ) +
  scale_fill_manual(
    values = c(
      "Reached this milestone" = colors$palette$col_reached,
      "Did not reach (partial journey)" = colors$palette$col_partial
    ),
    breaks = c("Reached this milestone", "Did not reach (partial journey)")
  ) +
  coord_cartesian(clip = "off") +

  # Labs
  labs(
    title = title_text,
    subtitle = subtitle_text,
    x = "Story progression milestones",
    y = "Share of players",
    fill = NULL,
    caption = caption_text
  ) +

  # Theme
  theme(
    plot.title = element_markdown(
      size = rel(2),
      family = fonts$title,
      face = "bold",
      color = colors$title,
      lineheight = 1.15,
      margin = margin(t = 5, b = 5)
    ),
    plot.subtitle = element_markdown(
      size = rel(0.8),
      family = fonts$subtitle,
      color = alpha(colors$subtitle, 0.88),
      lineheight = 1.3,
      margin = margin(t = 5, b = 20)
    ),
    plot.caption = element_markdown(
      size = rel(0.65),
      family = fonts$subtitle,
      color = colors$caption,
      hjust = 0,
      lineheight = 1.4,
      margin = margin(t = 20, b = 5)
    ),
    legend.position.inside = c(0.12, 0.92),
    legend.justification = c(0, 1),
    legend.key.spacing.y = unit(0.3, "cm"),
    legend.key.height = unit(0.8, "lines"),
    legend.key.width = unit(1.2, "lines"),
    legend.text = element_text(size = rel(0.7)),
    legend.margin = margin(r = 10),
  )
```
#### 7. Save
```{r}
#| label: save

### |-  plot image ----
save_plot(
  p,
  type = 'swd',
  year = 2026,
  month = 01,
  width  = 12,
  height = 8,
  )
```
#### 8. Session Info
::: {.callout-tip collapse="true"}
##### Expand for Session Info
```{r, echo = FALSE}
#| eval: true
#| warning: false
sessionInfo()
```
:::
#### 9. GitHub Repository
::: {.callout-tip collapse="true"}
##### Expand for GitHub Repo
The complete code for this analysis is available in [`swd_2026_01.qmd`](https://github.com/poncest/personal-website/tree/master/data_visualizations/SWD%20Challenge/2026/swd_2026_01.qmd). For the full repository, [click here](https://github.com/poncest/personal-website/).
:::
#### 10. References
::: {.callout-tip collapse="true"}
##### Expand for References
**SWD Challenge:**
- Storytelling with Data: [January 2026 - Plot Partial Information](https://community.storytellingwithdata.com/challenges/jan-2026-plot-partial-information)
**Data Source:**
- Steam Community. (2026). *The Witcher 3: Wild Hunt - Global Achievement Statistics*. Retrieved January 1, 2026, from <https://steamcommunity.com/stats/292030/achievements>
**Game Information:**
- CD Projekt Red. (2015). *The Witcher 3: Wild Hunt* [Video game]. Steam. <https://store.steampowered.com/app/292030/>
- Witcher Wiki: [The Witcher 3 Achievements](https://witcher.fandom.com/wiki/The_Witcher_3_achievements)
**Supporting References:**
- Steam Community Guide: [The Witcher 3 - 100% Achievement Guide](https://steamcommunity.com/sharedfiles/filedetails/?id=2213764030) (for understanding achievement progression and validation)
- TrueAchievements.com: [The Witcher 3 Achievement Data](https://www.trueachievements.com/game/The-Witcher-3-Wild-Hunt/achievements) (cross-reference)
**Data Details:**
- Steam App ID: 292030
- Date Accessed: January 1, 2026
- Data represents cumulative achievement unlock percentages from game launch (May 2015) through January 2026
- Sample size: Millions of Steam players (exact number not publicly disclosed)
:::
#### 11. Custom Functions Documentation
::: {.callout-note collapse="true"}
##### 📦 Custom Helper Functions
This analysis uses custom functions from my personal module library for efficiency and consistency across projects.
**Functions Used:**
- **`fonts.R`**: `setup_fonts()`, `get_font_families()` - Font management with showtext
- **`social_icons.R`**: `create_social_caption()` - Generates formatted social media captions
- **`image_utils.R`**: `save_plot()` - Consistent plot saving with naming conventions
- **`base_theme.R`**: `create_base_theme()`, `extend_weekly_theme()`, `get_theme_colors()` - Custom ggplot2 themes
**Why custom functions?**\
These utilities standardize theming, fonts, and output across all my data visualizations. The core analysis (data tidying and visualization logic) uses only standard tidyverse packages.
**Source Code:**\
View all custom functions → [GitHub: R/utils](https://github.com/poncest/personal-website/tree/master/R)
:::
